GDGraph 2.1 English Version
Revisa también la versión en español de este documento.
This document provides a reference of the use of GDGraph 2.1. To get yourself started, first you'll need (obviously) PHP 4.3, or higher, and GD 2, or higher; although it hasn't been tested on other systems, it probably will work with PHP 3 and up, but GD 2 is needed.
The way this class works (for now, comments are welcome), is that it will return an online
PNG image to your browser after any of it's functions
(bar_graph, pie_graph or line_graph are called upon, including it's header
(so you don't need to call the PHP header function before any of them).
And before we start, this software is distributed with and by the GPL
License (read the GNU Public License.txt file that
should be included with every release of this product).
If you have any comments about this software don't hesitate in contacting us by email or by our contact form.
Table of Contents
Constructor
GDGraph(width, height [, title [, red_bg [, green_bg [, blue_bg [, red_line [,
					green_line [, blue_line [red_font [, green_font [, blue_font [, legend [, legend_x [, legend_y [,
					legend_border [, transparent_background [, line_thickness]]]]]]]]]]]]]]]]);
| Argument | Type | Description | Default |
|---|---|---|---|
| width,height | int | Image width and height. | Required |
| title | string | Graph title. | Blank title |
| red_bg,green_bg, blue_bg | int | [0-255] Red, green and blue components for graph background. | 255,255,255 (White) |
| red_line, green_line, blue_line | int | [0-255] Red, green and blue components for all lines. | 0,0,0 (Black) |
| red_font, green_font, blue_font | int | [0-255] Red, green and blue components for all strings. | 0,0,0 (Black) |
| legend | boolean | To put a legend or not. | True |
| legend_x, legend_y | int | [0-width, 0-height] X and Y legend position, if a legend is present (0,0 is top left corner). | Top right corner |
| legend_border | boolean | To put a border around the legend. | True |
| transparent_background | boolean | To make the background transparent. Because of the fact that GDGraph uses PNG files to paint the graphs, and that Internet Explorer doesn't handle at all transparency in PNGs, this feature doesn't work on Internet Explorer 6 (it will in IE 7.1). We won't make it work until Microsoft gets its act together and adds this functionality to IE 6. You're more than welcome to change lines 526 and 527, 839 and 840, and 944 and 945 of gdgraph.php to the following:
Which will make GDGraph give a GIF image (instead of a PNG) with which Internet Explorer can handle transparency. You can hold Microsoft responsible for this burden. |
False |
| line_thickness | int | X-axis, Y-axis, and grid lines thickness | 1 |
Bar Graph
bar_graph(data[, x_title [, y_title [, bar_width_percentage [, grid_presence
					[, bar_border_presence]]]]]);
Returns
A PNG image with a bar graph of the information contained in data.
| Argument | Type | Description | Default |
|---|---|---|---|
| data | array | Data from which the graph will be created. Format:
Where bar1 is the name of the first bar, value1 is it's value; red1, green1, and blue1 it's color components, and 3d1 it's 3D thickness (these last four can be ommited, but will default to 0). |
Required |
| x_title, y_title | string | Graph x axis and y axis titles. | Blank titles |
| bar_width_percentage | int | [0-100] Percentage of the space given to a certain bar that that bar will occupy. | 90 |
| grid_presence | int | [0-10] Presence of grid, 0 being none and 10 being a solid line (see Example 2 for further explanation). | 0 |
| bar_border_presence | boolean | Presence of border around bars. | True |
Example 1
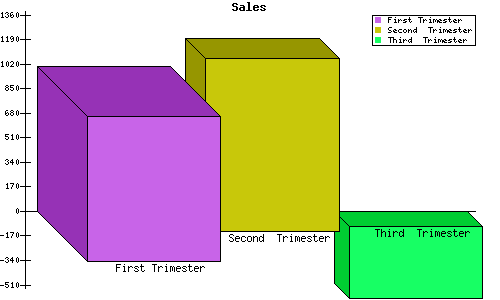
<?phprequire_once("gdgraph.php");$gdg = new GDGraph(500,300,"Sales");$arr = Array('First Trimester' => Array(1000,200,100,1000,50),'Second Trimester' => Array(1200,200,200,10,20),'Third Trimester' => Array(-500,23,255,100,15));$gdg->bar_graph($arr); //Line A?>
Will give out the following image:
Example 2
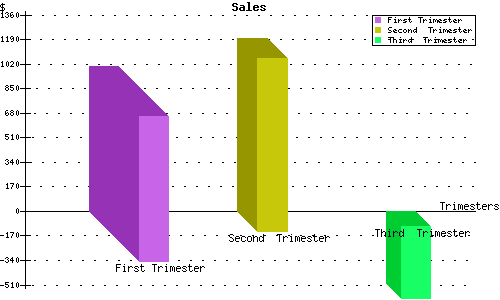
If we change Line A to:
$gdg->bar_graph($arr,“$”, “Trimesters”, 20, 5, false); //Line A
It will give out the following image:
Pie Graph
pie_graph(data [, pie_fill_percentage [, pieces_labels [, starting_degree [, outline
					[, 3D_thickness]]]]]);
Returns
A PNG image with a pie graph of the information contained in data.
| Argument | Type | Description | Default |
|---|---|---|---|
| data | array | Data from which the graph will be created. Format:
Where pie1 is the name of the first slice, value1 is it's value, and red1, green1, and blue1 it's color components (these last three can be ommited, but will default to 0). All values (value1, value2, etc.) are absolute, meaning that they don't have to be percentages, GDGraph will turn them into percentages for you. |
Required |
| pie_fill_percentage | int | [0-100] Percentage of the image space filled by the pie graph. | 100 |
| pieces_labels | boolean | To put each piece label or not. | True |
| starting_degree | int | The starting point from which the pie will be drawn. | 0 |
| outline | boolean | To put the outline around the pie pieces. | True |
| 3D_thickness | array | How thick each piece will be. Format:
Where pie1 is the name of the first slice and thick1 is it's thicknesss in pixels. |
0 for each omitted slice |
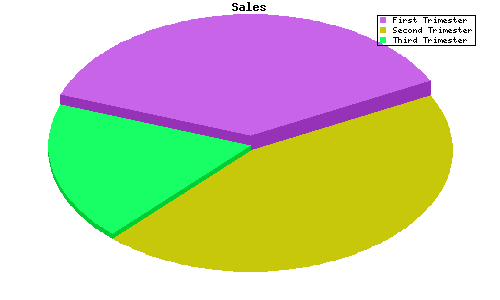
Example 1
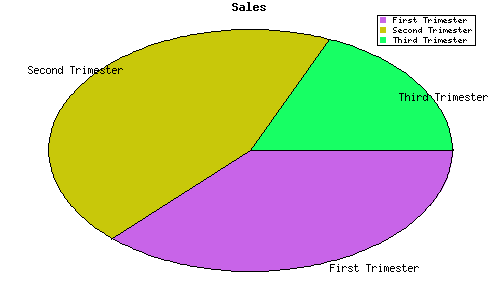
<?phprequire_once("gdgraph.php");$gdg = new GDGraph(500,300,"Sales");$arr = Array('First Trimester' => Array(1000,200,100,1000),'Second Trimester' => Array(1200,200,200,10),'Third Trimester' => Array(500,23,255,100));$gdg->pie_graph($arr); //Line A?>
Will give out the following image:
Example 2
If we add the following before Line A:
$arr_3D = Array('First Trimester' => 15,'Second Trimester' => 0,'Third Trimester' => 5);
And if we change Line A to:
$gdg->pie_graph($arr,90,false,200,false,$arr_3D); //Line A
It will give out the following image:
Line Graph
line_graph(data [, colors [, x_labels [, x_title [, y_title [, paint_dots [,lines_thickness
					[, x_lower_value [, x_upper_value [, y_lower_value [, y_upper_value]]]]]]]]]]);
Returns
A PNG image with a line graph of the information contained in data
| Argument | Type | Description | Default |
|---|---|---|---|
| data | array | Data from which the graph will be created. Format:
Where lin1 is the name of the first line, and t1, t2, t3, etc. are it's values going through time. Obviously, all lines must have the same number of t's, if not, it will only draw until it reaches the end of that line's t's. |
Required |
| colors | array |
Color de cada línea. Format:
Where lin1 is the name of the first line, and red1, green1, y blue1 are its color components. |
0 for each omitted line. However, every omitted line won't be shown in the legend. |
| x_labels | array | Etiquetas para los valores en el eje X. Format:
Where all the t_label's are the label of each it's corresponding t in data, counting from left to right. |
If these aren't included, no labels will appear in the X axis |
| x_title, y_title | string | Graph X axis and Y axis titles. | Blank titles |
| paint_dots | boolean | To paint the little squares between each break of a line. | True |
| lines_thickness | array | Grosor de cada línea. Formato:
Where lin1 is the name of the first line, and thick1 is it's thickness. |
1 for each omitted line. |
| grid_presence | int | [0-10] Presence of grid, 0 being none and 10 being a solid line (see Example 3 for further explanation). | 0 |
| x_lower_value,x_upper_value, y_lower_value, y_upper_value | int | Zoom area. If these values aren't NULL, GDGraph will substitute it as the lower (or upper) value in the X or Y axis which the graph will show. If any of them are NULL, GDGraph will use the biggest (or lowest) quantity found in the data array for that specific value. For the X axis values, no negatives are allowed, and the axis starts at 0. For further explanation, take a look at Example 3. | NULL (autofit) |
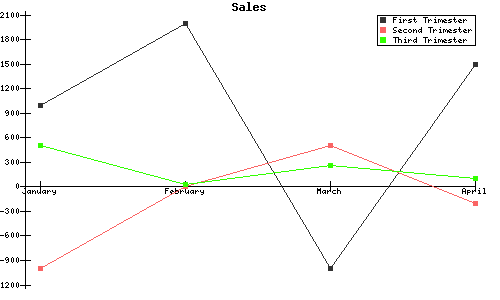
Example 1
<?phprequire_once("gdgraph.php");$gdg = new GDGraph(500,300,"Sales");$arr = Array('First Trimester' => Array(1000,2000,-1000,1500),'Second Trimester' => Array(-1000,0,500,-200),'Third Trimester' => Array(500,23,255,100));$colors = Array('First Trimester' => Array(50,50,50),'Second Trimester' => Array(250,100,100),'Third Trimester' => Array(50,255,0));$x_labels = Array('January','February','March','April');$gdg->line_graph($arr,$colors, $x_labels); //Line A?>
Will give out the following image:
Example 2
If we add the following before Line A:
$thicknesses = Array('First Trimester' => 10,'Second Trimester' => 6,'Third Trimester' => 3);
And change Line A to:
$gdg->line_graph($arr,$colors, $x_labels,"Trimesters","$", false,$thicknesses, 5); //Line A
It will give out the following image:

Example 3
If we change Line A to:
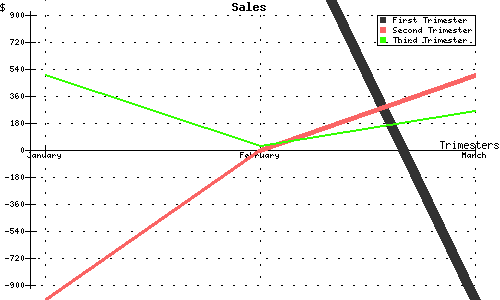
$gdg->line_graph($arr,$colors,$x_labels,"Trimesters","$",false,$thicknesses,5,0,2,-900,900); //Line A
The resulting image will be:
